How Much Should You Allocate For Your Marketing Budget in 2018?
To answer that question, this report from CMO Survey conducted by Deloitte might offer some good insights.

According to the report, 6.9% is the average percentage of marketing budget against revenue in 2017. Below is a breakdown by B2B vs. B2C, as well as product vs. service.
| Category |
Marketing Budget / Revenue |
| Overall |
6.90% |
| B2B Product |
6.40% |
| B2B Services |
6.80% |
| B2C Product |
8.60% |
| B2C Services |
7.30% |
The following tables show the average percentage of marketing budgets broken down by industry category and revenue size:
| Industry Category |
Marketing Budget / Revenue |
| Banking / Finance / Insurance |
3.90% |
| Communication / Media |
6.60% |
| Consumer Packaged Goods |
11.00% |
| Consumer Services |
17.40% |
| Education |
18.50% |
| Energy |
2.20% |
| Healthcare |
6.20% |
| Manufacturing |
3.20% |
| Mining / Construction |
2.00% |
| Service Consulting |
9.40% |
| Retail / Wholesale |
3.80% |
| Tech/Software/Biotech |
8.50% |
| Transportation |
11.20% |
| Revenue Size Category |
Marketing Budget / Revenue |
< $25 MILLION |
12.20% |
| $26 – 99 MILLION |
7.00% |
| $100 – 499 MILLION |
5.90% |
| $500 – 999 MILLION |
3.40% |
| $1 – 9.9 BILLION |
6.00% |
| > $10 BILLION |
9.70% |
Source: CMO.Deloitte
As you can see, organizations with a lower revenue size are willing to spend more of their budget on marketing in order to grow. Of course, those are just moderate averages and you don’t have to follow these numbers. There are always exceptions: when you take a look at a rapid growing software company like Salesforce, the marketing & sales spend accounts for nearly 45 – 50% of their revenue, so it’s dependent on your strategy.
You may be wondering where the increased marketing spends have gone. The answer is digital – you can see the trend chart below:
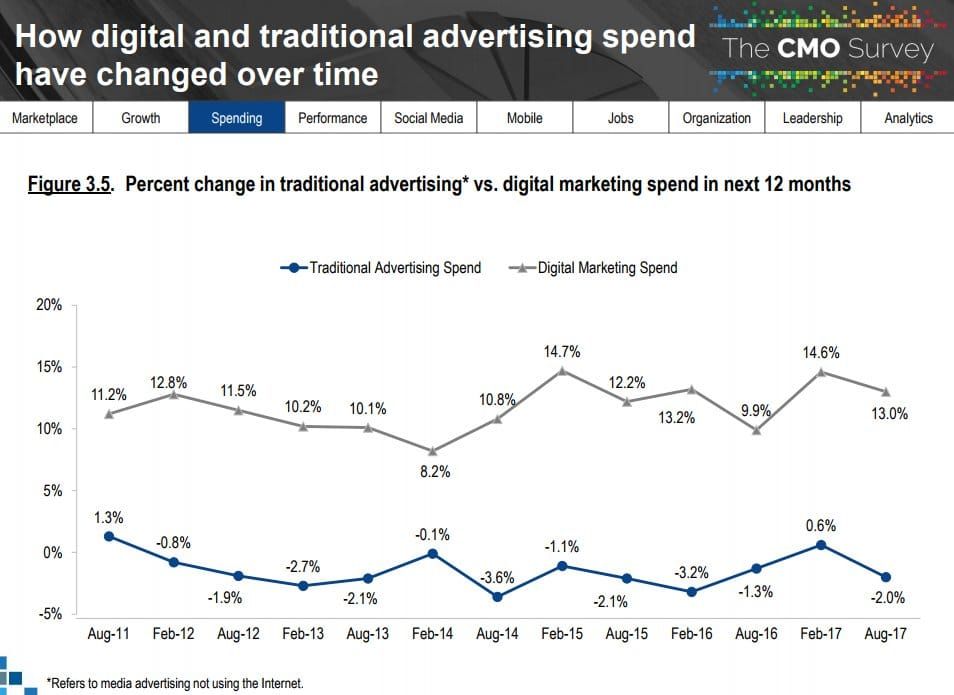
Digital marketing has continued to grow through 2018. Global digital ad spends are projected to increase by 17.4 percent to $583.91 billion according to CNBC. This is a bit surprising given P&G and other organizations are concerned about affecting brand safety by placing digital ads. P&G said they were planning to decrease their budget for digital ads since digital ads are unclear in terms of placement and can potentially be placed next to extremist content.
What are key drivers for the growth? As mentioned in 20 Marketing Statistics & 5 Trends To Implement In 2018, a combination of digital video and mobile will be key drivers for growth in digital marketing spends.
Google and Facebook are leading the rapid growth. Google accounts for 33% of the total net digital ad revenue share worldwide and Facebook accounts for 16.2% in 2017.
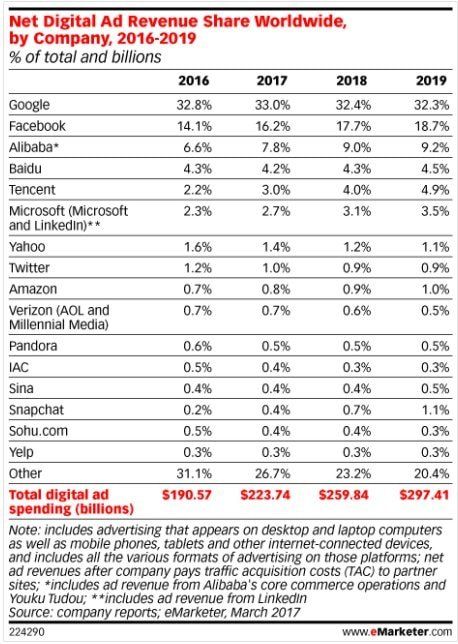
Source: eMarketer
In terms of which advertising channels marketers have invested in throughout 2017, social ads hold the highest growth at 72% according to a survey conducted by Hanapin Marketing.
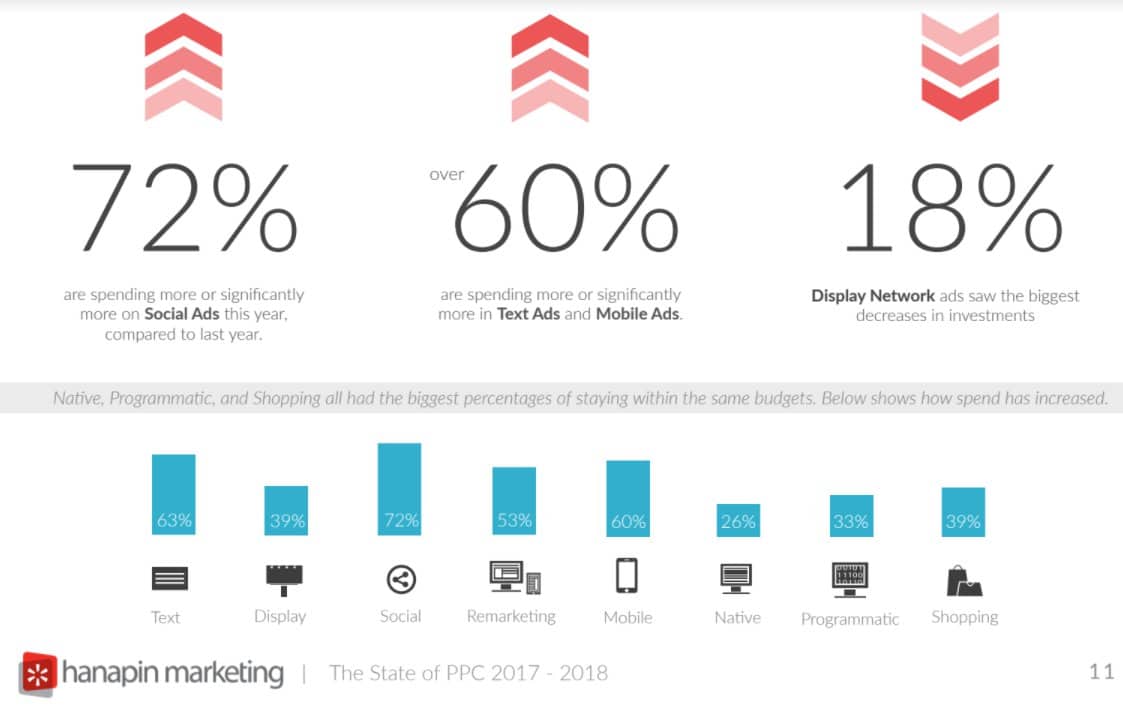
Source: Hanapin Marketing
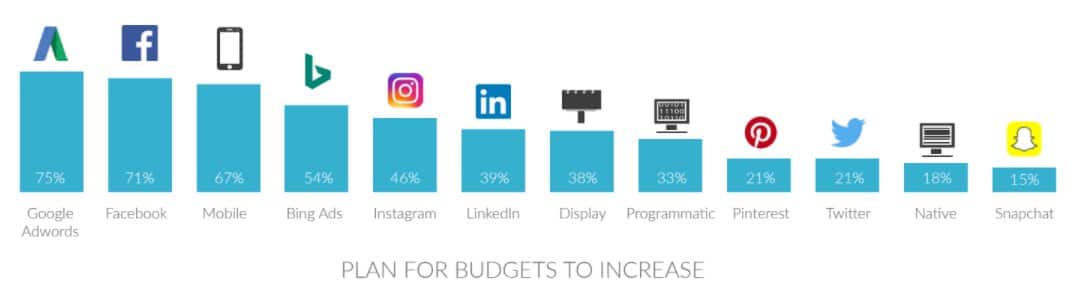
Hanapin Marketing asked the same marketers how their budgets will change in next 12 months. Google Adwords, Facebook and Mobile are the major mediums where marketers will be increasingly invest their budgets.
eMacity Leads
www.emacityleads.com